How to estimate asphalt plant capacity from stockpile size
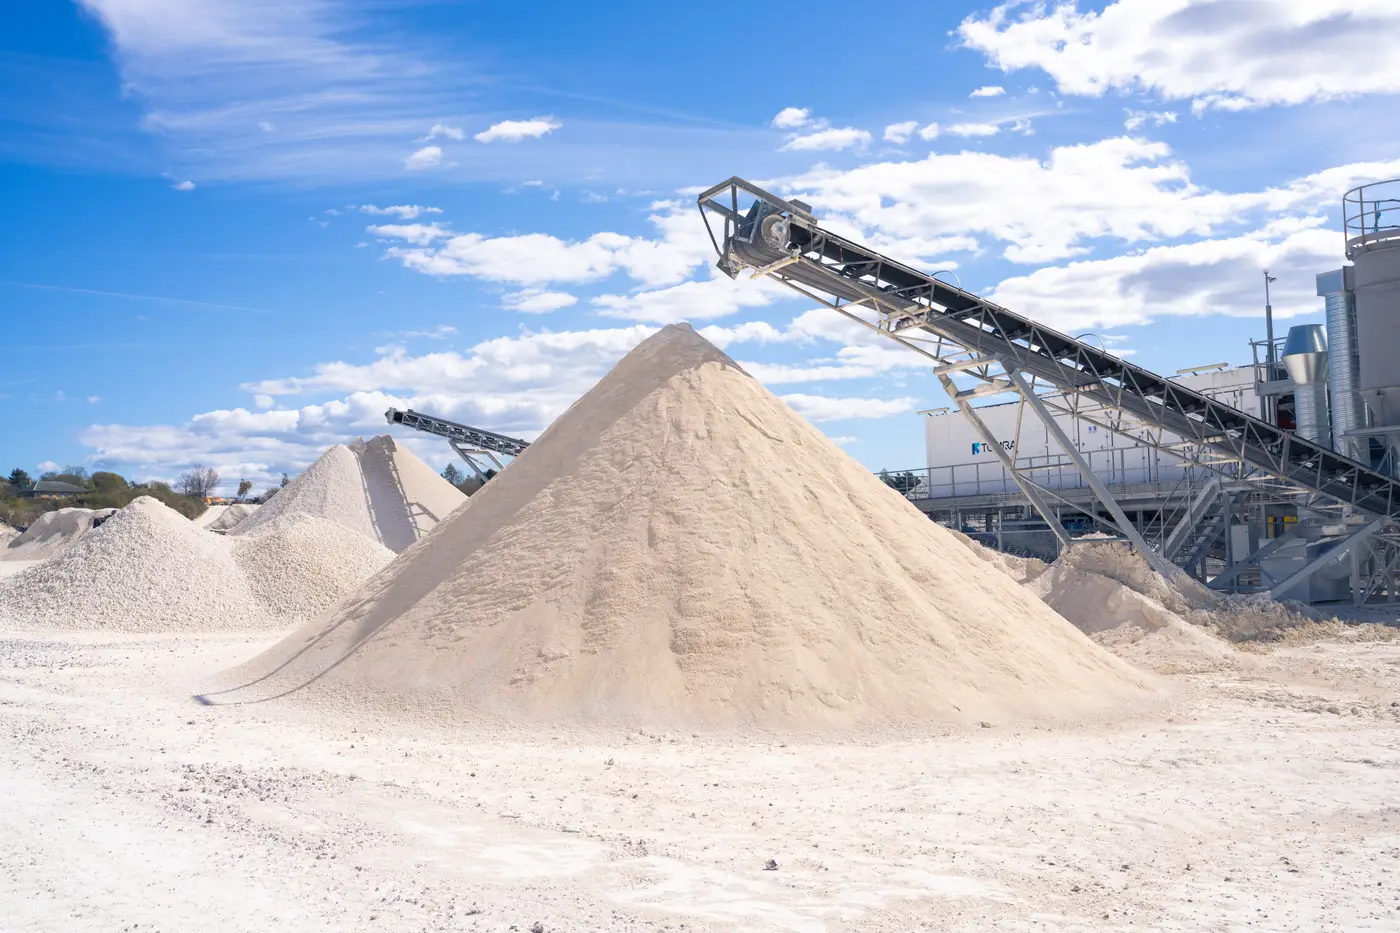
You can't get a capacity number off a plant without walking the scale house, and most territories don't give you that access. What you can usually see, from the road, from a flyover, or from imagery, is the stockpile yard. It turns out that's not a bad substitute.
A batch or drum plant that's running real tonnage keeps real aggregate on the ground to feed it. A plant that's limping along on two trucks a day doesn't. Stockpile footprint, pile height, and the number of separate piles for different gradations all track with how much the plant actually moves in a season. None of that is a certified number, but for ranking plants across a territory by who's running hot and who's running light, it's close enough to be useful.
Why stockpile footprint tracks capacity
Plants carry a buffer. Shift changes, hauling gaps, a rained-out Tuesday, all of that gets absorbed by aggregate already sitting in the yard rather than aggregate still on a truck somewhere. The bigger the plant's rated tons per hour, the bigger that buffer has to be just to keep the drum fed without a bin running empty mid-batch. So footprint and pile count end up correlating with throughput even though nobody designed it that way on purpose.
The correlation breaks down at the extremes. A plant with a huge yard and old, weathered piles might be sitting on inventory from two seasons ago rather than running hard. A plant with a tight footprint might be turning stock over fast because it's close to its source pit and doesn't need to carry much. Treat the footprint as a proxy for capacity and recent activity together, not a precise TPH reading.
Turning a footprint into a tons estimate
Most stockpiles are close enough to a cone or a wedge to use basic volume geometry. For a conical pile, measure the base diameter and the height, then run the standard cone volume formula (one-third pi r-squared h). For an elongated or wedge-shaped pile against a retaining wall, a triangular-prism approximation gets you closer. Multiply the resulting cubic volume by bulk density, which runs roughly 1.4 to 1.6 tons per cubic yard for most crushed aggregate, lighter for lightweight or recycled material, heavier for wet sand.
That gives you tons on the ground, which is one input. To get toward a tons-per-hour proxy, compare that figure against a typical run day for a plant of that general size class, or just track the number up or down year over year against the same plant. A yard that doubles in footprint between two passes is telling you something about demand even without a precise TPH conversion. A yard that shrinks and stays shrunk across a second look is a different signal entirely, and often a better one for finding replacement candidates than the footprint number alone.
What throws the number off
Most yards aren't one clean pile. A plant running two or three mix designs keeps separate stockpiles for each aggregate gradation, so the total footprint you're measuring is really several smaller volumes stacked next to each other, not one number you can plug into a single formula. Reclaimed asphalt pavement piles get counted by some analysts and excluded by others, and they behave differently under a tarp or cover than exposed virgin aggregate does. Seasonal buildup ahead of paving season inflates the picture for a few weeks every spring regardless of the plant's actual rated capacity. And silo count matters as much as stockpile size does: a plant with a tall footprint but only one small surge silo is capped downstream in a way the yard alone won't tell you.
None of that makes the stockpile method useless. It makes it a first pass, the kind of thing you'd use to decide which fifteen plants in a sixty-plant territory are worth a closer look, before anyone picks up a phone.
Doing that by hand, one plant at a time, means driving or calling every yard in a territory and hoping nobody's gate is locked. Asphalt Plant Mapping tracks silo, hopper, and stockpile configuration across a territory once a year from imagery, so you get the capacity signal without the windshield time. If you're building a territory list this way already, it's worth seeing what a yearly pass looks like for your region.